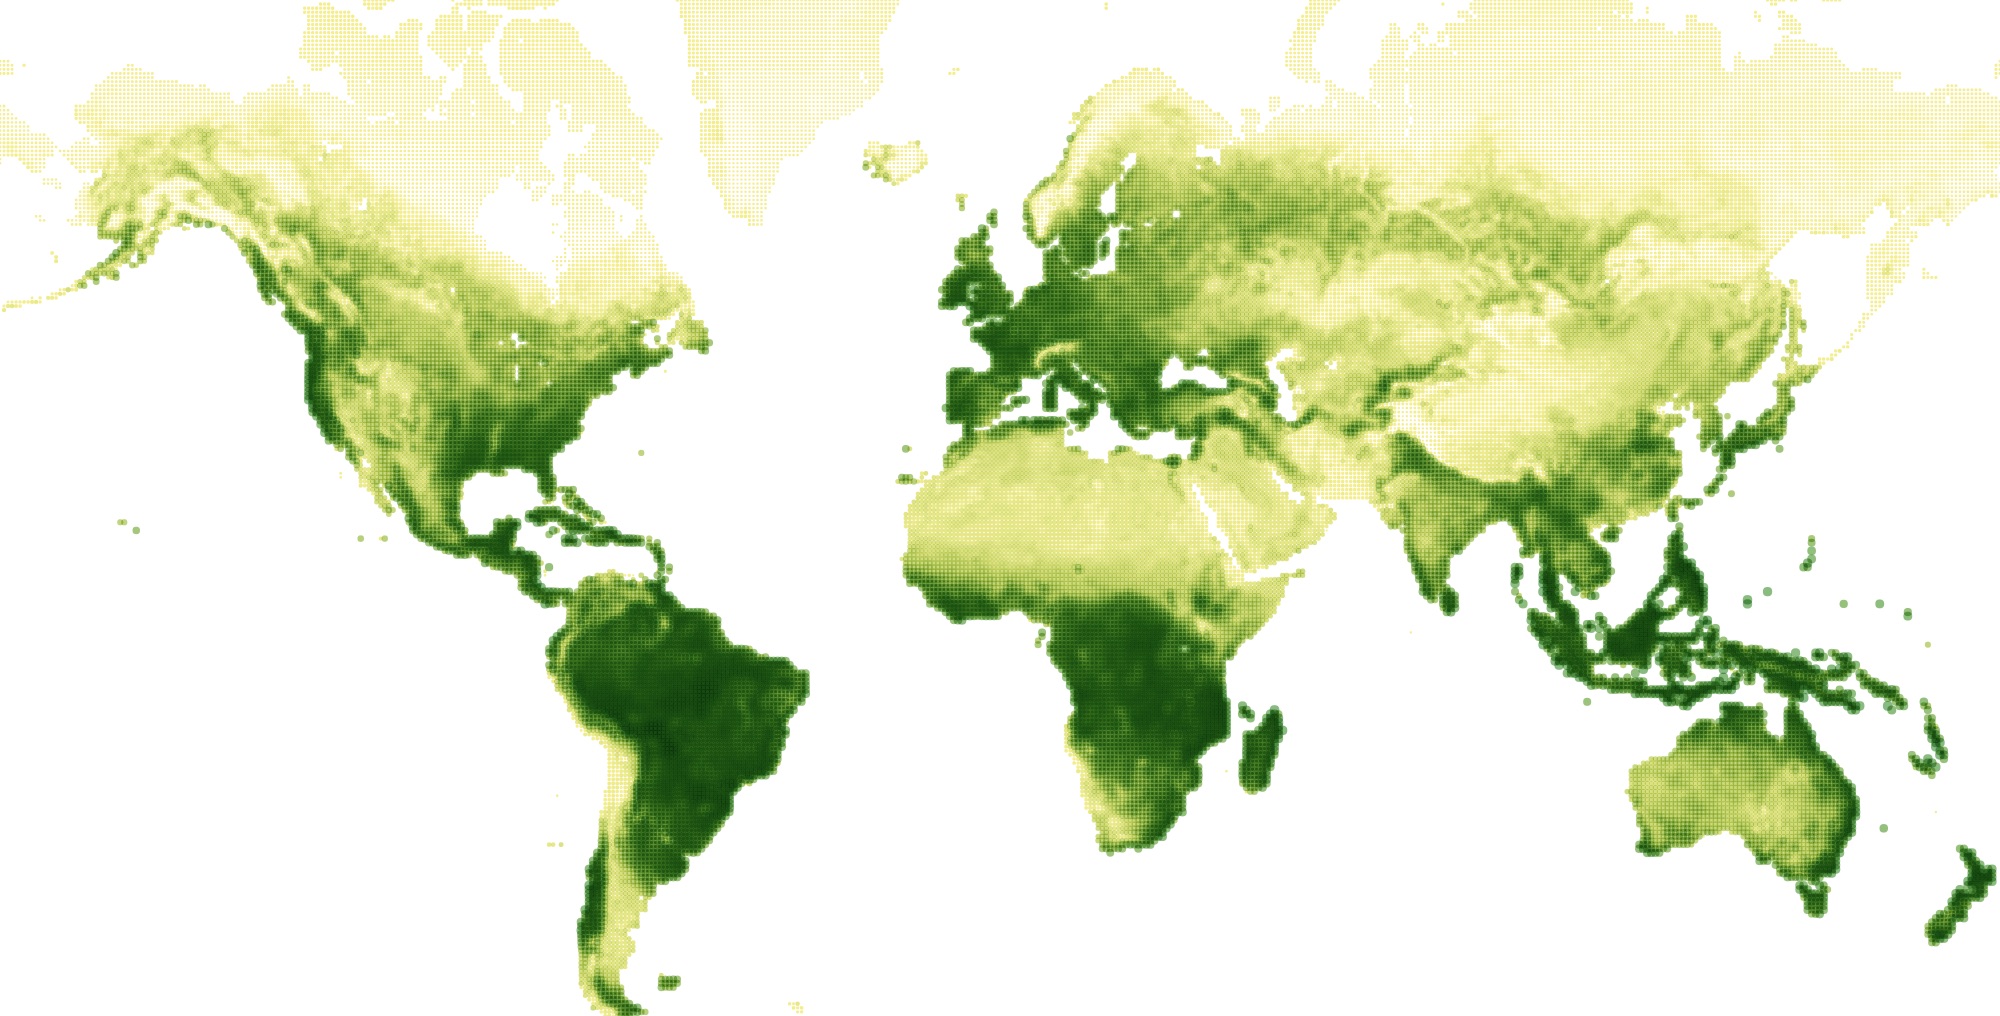
We all know that our Earth goes through a seasonal cycle, especially for the latitudes farther away from the equator. In the fall the "deciduous" plants lose their leaves only to grow back again in the next spring.
The animation happening in the map above, through all 52 weeks of 2016, visualizes these seasonal cycles. The rise and fall of the growing season in the Northern Hemisphere is particularly visible. However, when focusing on different parts of the planet other cycles & different seasons become noticeable as well; the Southern regions of Africa, Brazil, and New Zealand, having the reverse cycle as the North, or India getting drier and drier up until the July when the monsoons start. The more often you watch the year go by, the more small details will start to stand out.
Watch and see our Earth "breathing" throughout the year. All living organisms depend on these cycles in the growth of plants; for food, for oxygen, and more. Although we humans have started to affect these cycles, hopefully this gorgeous spectacle will be part of our lives for millennia to come.
The data comes from NOAA STAR, the center for satellite applications and research, who use the VIIRS (Visible Infrared Imager Radiometer Suite) sensor onboard Suomi National Polar-orbiting Partnership (SNPP) satellite to get detailed vegetation information of our Earth every week.
The specific variable visualized in the map is called 'Greenness', or in more scientific terms; the no noise (smoothed) Normalized Difference Vegetation Index (SMN). Greenness can be used to estimate the start and senescence of vegetation, start of the growing season and phenological phases. For areas without vegetation (desert, high mountains, etc.), the displayed values characterize surface conditions.
Animating 50.000 circles in the browser, all separately from each other through different sizes, colors & opacities became a real technical challenge. In the end 3 different methods were tested to see which one would appear most natural. For those interested to see the differences, you can find the (slow) pure canvas version here, the pixi.js WebGL version here and the regl WebGL version here.